Digital storytelling
Digital storytelling

The AFghanistan papers
Project management and editing: Over the course of several months, I led a team of three visual journalists and developers who built a document database for this series. In this role, I facilitated brainstorms, defined goals and philosophies, provided feedback, wrote text, set benchmarks and timelines and coordinated extensively with the story editors and reporter. The result was a user-friendly database and source material documents that were seamlessly integrated into the story text.

The shattered lives of champlain towers south
Visual reporting, project management, and editing: This story, published one week after the Champlain Towers South condos collapsed, lent a unique human dimension to the tragedy. I was an integral contributor to this piece from beginning to end. First, by using building blueprints and real estate listings to create unit-by- unit floor plans and identify which condos were affected. Later, with input from the graphics reporter, writer, photo editor and designer, I developed a cohesive narrative structure and visual presentation based on those unit numbers. I was also responsible for giving final sign off on the text and optimizing the piece for promotion.

U.S. coronavirus tracker and DC/Maryland/Virginia tracker
Coordination, project management, editing: I was the primary editor responsible for building the initial version of our local covid tracker starting in March 2020. It began as a way to track individual cases and deaths in the area and evolved to include dynamically updating interactive charts and tables. In 2021, I became the primary editor on our U.S. and world trackers. Myself, along with three reporters/developers have been in charge of maintaining and updating the page as the pandemic — and the page's audience — evolves. I’ve also spearheaded the front and backend implementation of several dynamically-updating embeds that allow the data to be used in other stories and on our homepage.

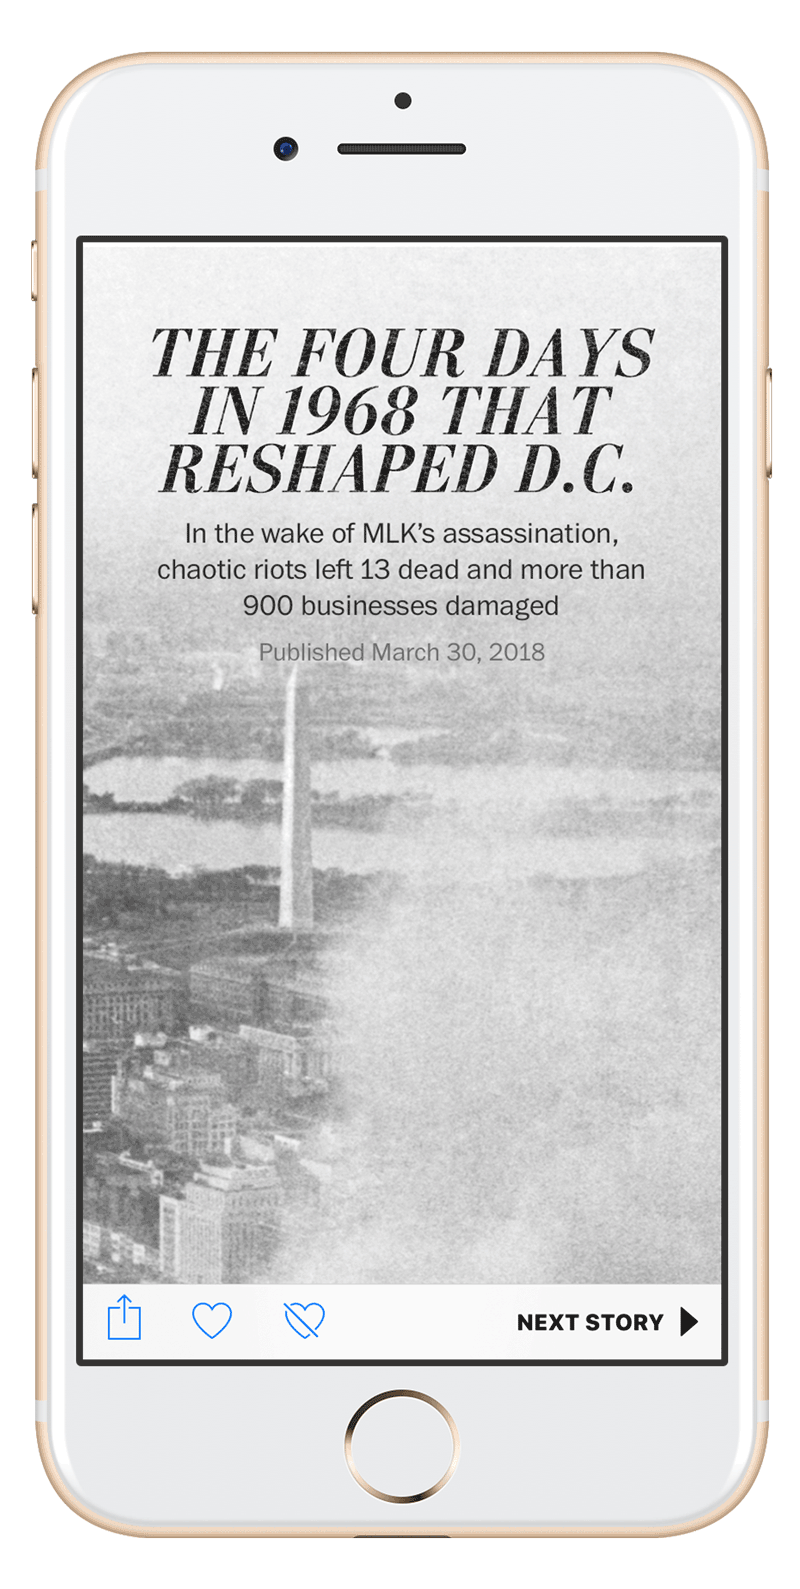
The four days in 1968 that reshaped D.C.
Content creation, project management, design: For this piece, which won the 2018 National Press Foundation award for innovative storytelling, I was one of five visual journalists tasked with creating a visual overview of the 1968 riots in D.C. I played a key role in determining the structure of the piece: selecting archival photos and videos, writing and editing text and providing feedback and edits on video interviews and data animations so they fit into the flow of the piece. Read more about how the project came together.

The DEA’s pain pill database
Project management and editing: In a little less than four days, I led a cross-departmental team in building this one-of-a-kind page. This involved working with editors, reporters, engineers, graphics reporters and designers to build the graphics and process the data while I wrote the text and built tables. We also created an interface that allowed other journalists to download and publish graphics and data about their communities. I also worked with our product team to find a business solution that allowed such critical information to be accessible outside of our paywall.

Visual timeline of Jan. 6
Content creation and editing: As I watched the events of January 6 unfold at the Capitol, I was struck by the double screen experience of what was happening inside and outside the building. With that in mind, I began assembling a timeline of key events based on alert timestamps, image metadata, social media posts and Post reporting. By the next morning, I had two graphics reporters on the story. With photo and video editors advising, we were able to launch the page within 48 hours. The approach had staying power: As we approached the one year anniversary, I saw that the page was getting a lot of organic search traffic and was able to leverage that data and give it a second life.

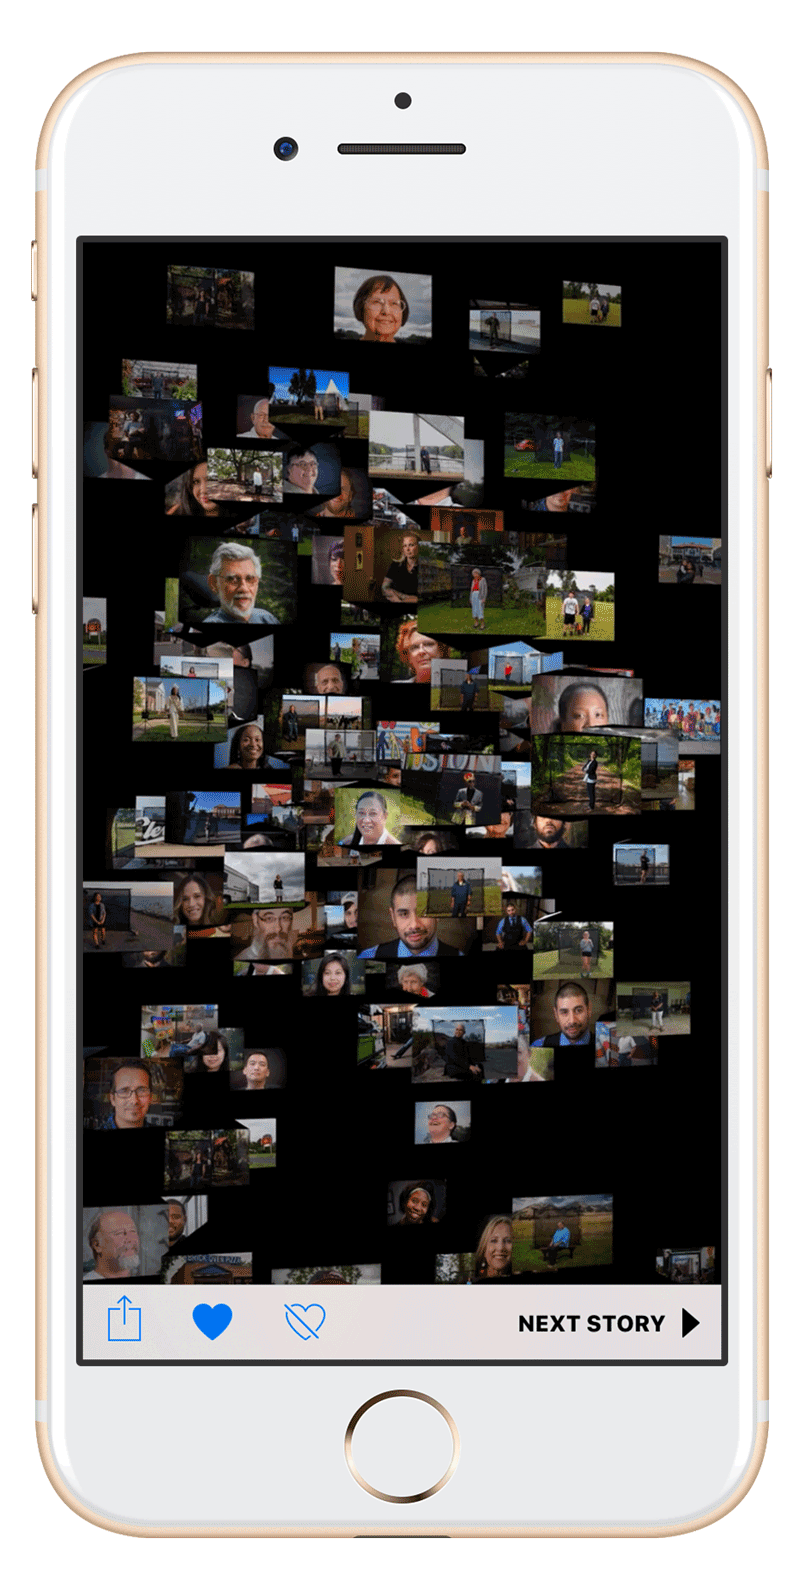
What unites us
Design and development, editing assistance, project management: This project sought to discover what Americans have in common in a time of great division. To do this, we used photos, audio and text to answer the question “What unites us?” Over a 6-month period I worked with text and photo editors to set benchmarks and to organize and edit 306 assets. I did this while designing and developing the interactive experience.

100 days of @realDonaldTrump
Design and development, content creation: To mark Donald Trump’s first 100 days in office, I collected and verified every tweet the President sent during that time and created a searchable visualization of his prolific Twitter use. I designed and developed the piece while working with our politics team to analyze the tweets and provide context to the piece. I also created the print presentation, which had a huge impact.

The drug industry’s triumph over the DEA
Art direction, design and development: This story was a critical investigation into the drug industry, Congress and the opioid crisis. It had a huge impact. I developed a visual identity for the project by creating a pill-bottle inspired color palette and art directing illustrations that were visually interesting but still fit the tone of the investigation. I played a key role in conceptualizing and implementing the alternative storytelling devices used throughout the story, such as the key player hover interaction and the timeline graphics.

Vacation finder
Design and development, art-direction: The goal of this project was to find a fun, interactive way to resurface some of our evergreen travel content. I worked closely with the travel editors to determine what content should be included, which questions we wanted to ask readers and how we would classify each location. I wrote and implemented most of the code for recording selections and displaying the results. I also art-directed the illustrations and animated them myself.
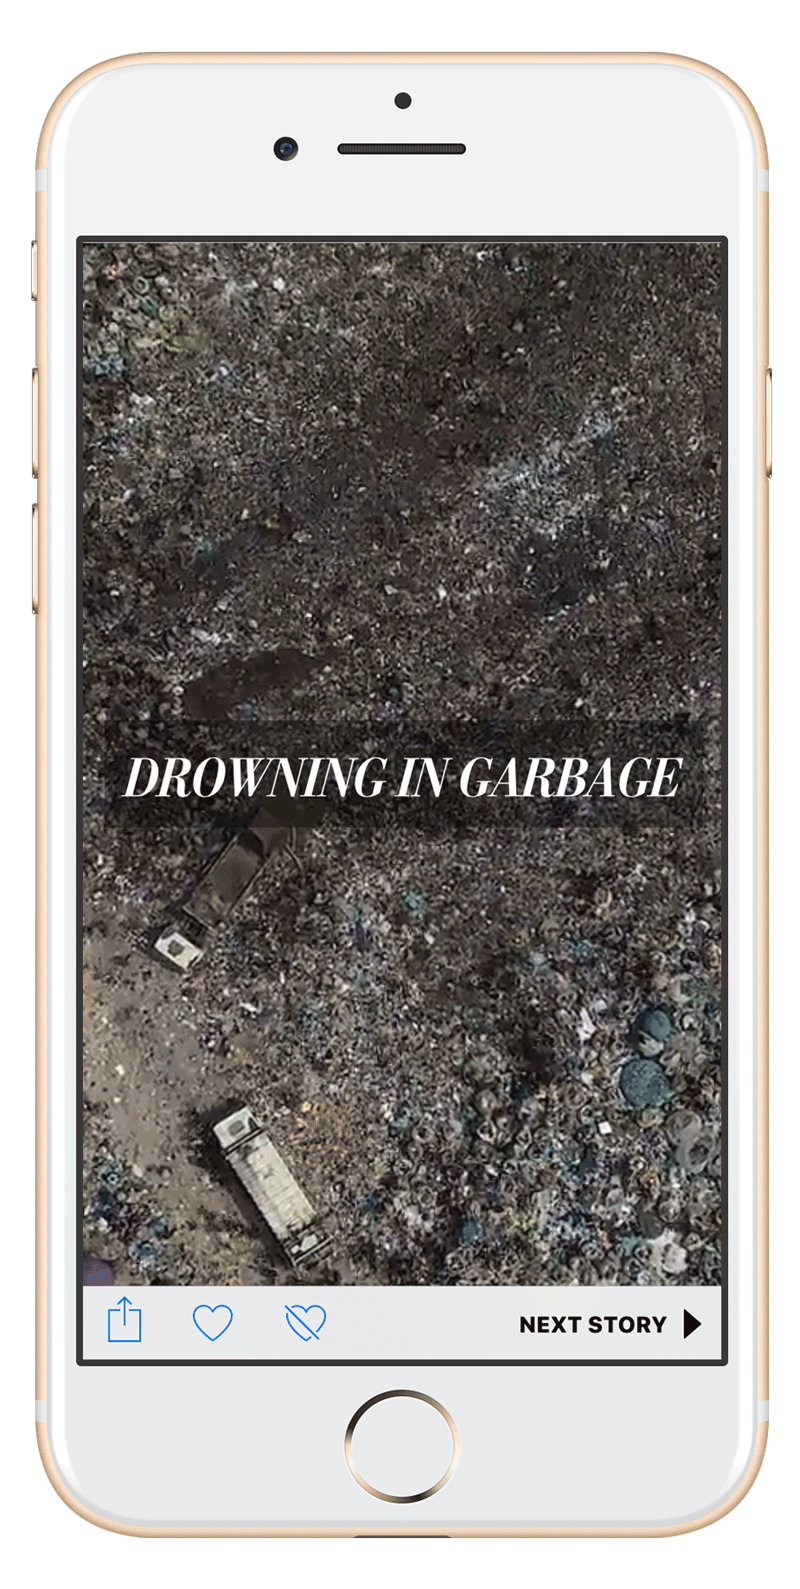
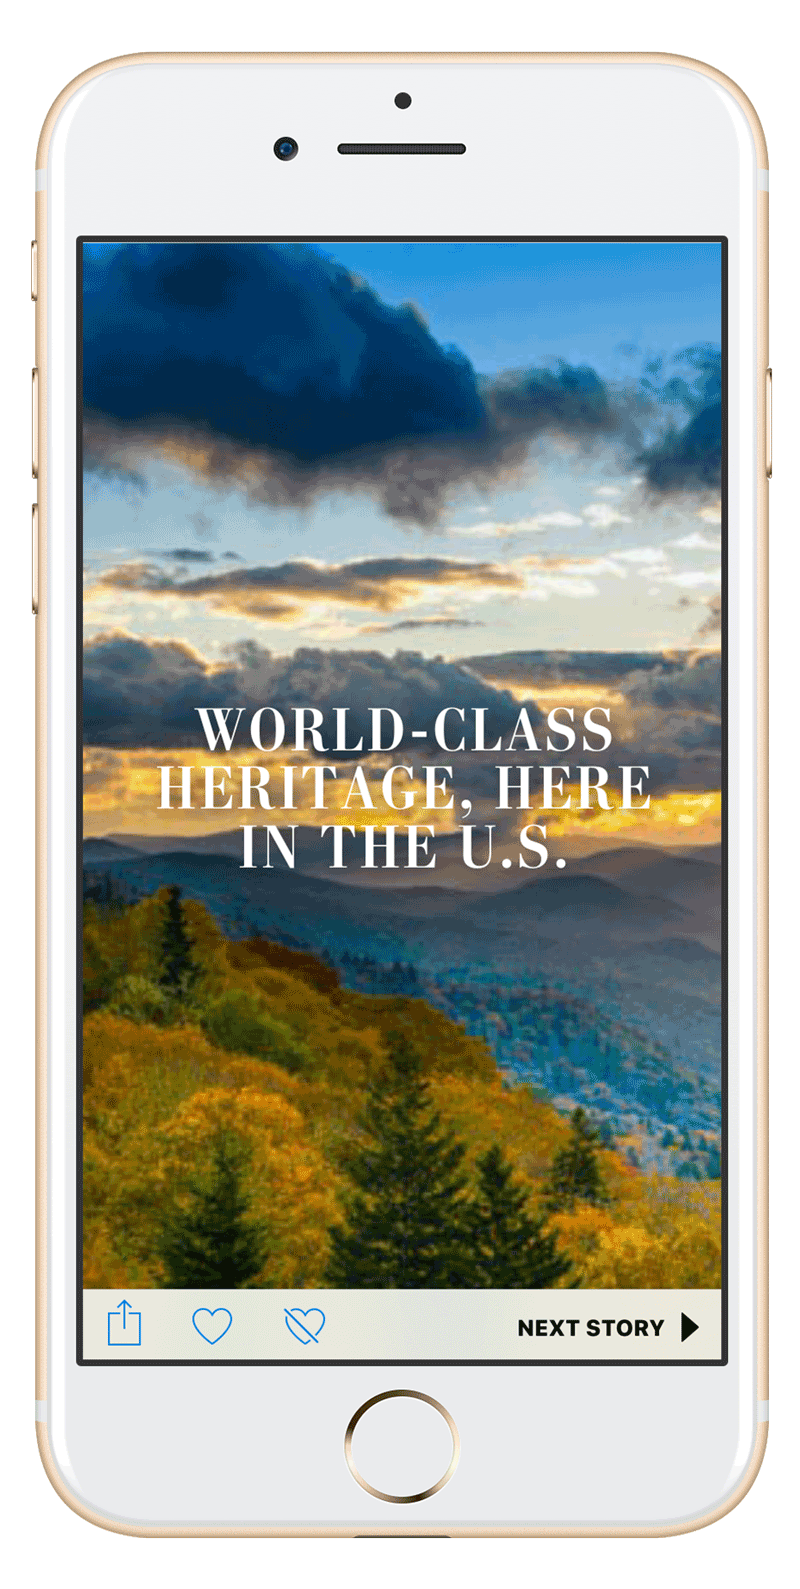
Apple news
From 2017-2018, one of my key responsibilities was to start and scale an initiative to publish custom presentations for Apple News. Alongside a product editor and developer, I created the tools and workflows to do this, while building and coding many of the Post’s earliest presentations and then, later, training others on how to do it. To see these custom presentations, click on the images below using an Apple device.